
Planning constraints checking tool user guide
How to view constraints, check constraints that intersect your chosen area, and change the basemap layer.
On this page
Summary
- This map can be used to view constraint layers, such as conservation areas.
- Plot your area of interest and check which constraint layers intersect.
- Change the underlying basemap.
View further instructions for using the map.
View constraints on the map
1. Navigate to the Main Menu at the top left of the page
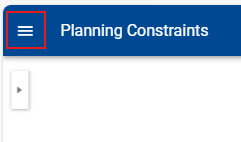
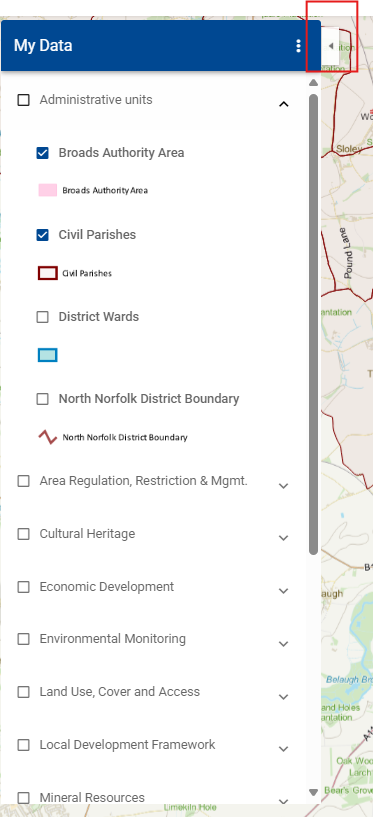
2. Select My Data
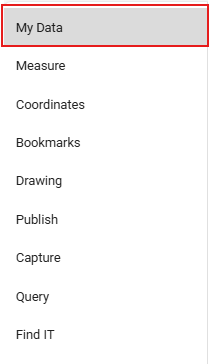
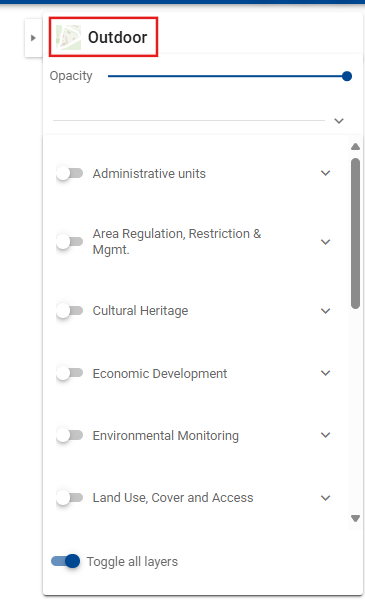
3. This will open a list containing groups of layers in the left pane. You can either turn on all the layers in the group using the box or expand the group using the down arrow to view the individual layers.
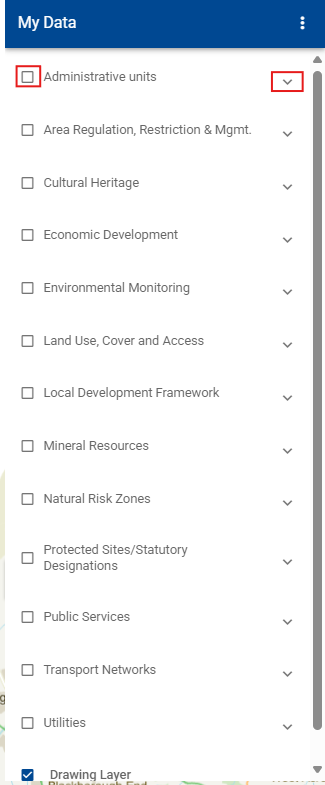
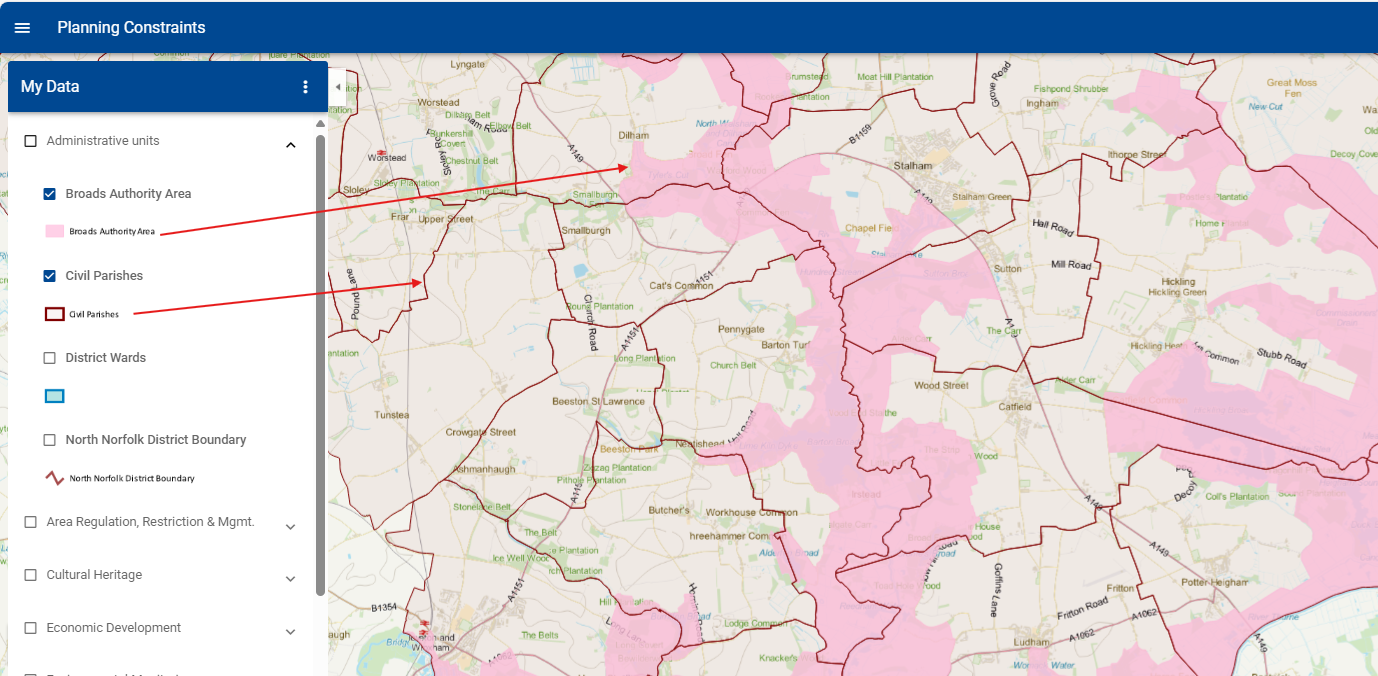
4. Turn on or off individual layers by selecting the box. The layer style will show once toggled on.
5. For more information on the layers, close the My Data pane using the side arrow.
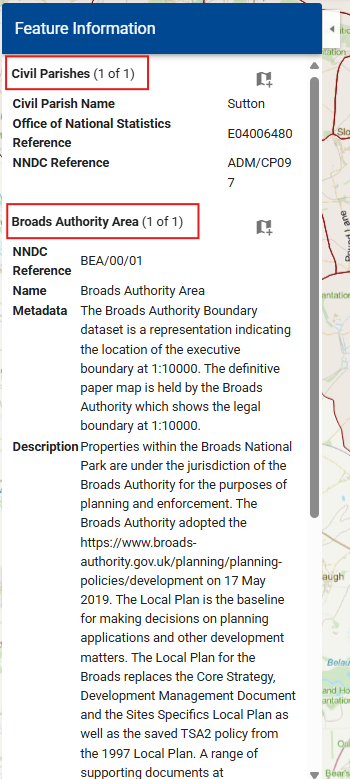
6. Then, on the map, select the constraint feature you're interested in. This will open the left pane displaying the feature information.
Check constraints that intersect your area of interest
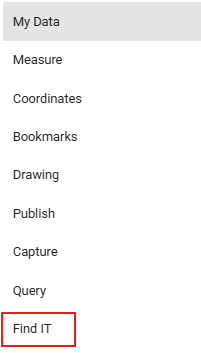
1. Navigate to the Main Menu at the top left of the page
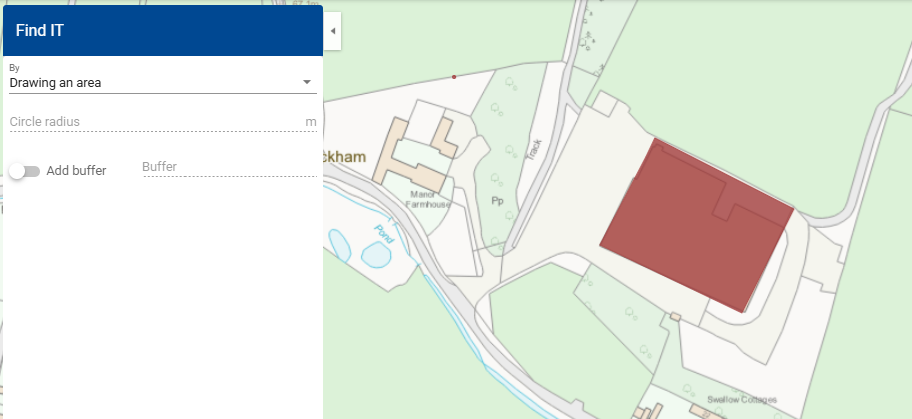
2. Select Find IT
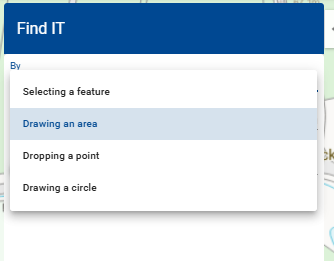
3. Choose the geometry type to create a plot.
4. Single click to create a point. Double click to finish drawing the shape. If you wish to re-draw your plot, click again.
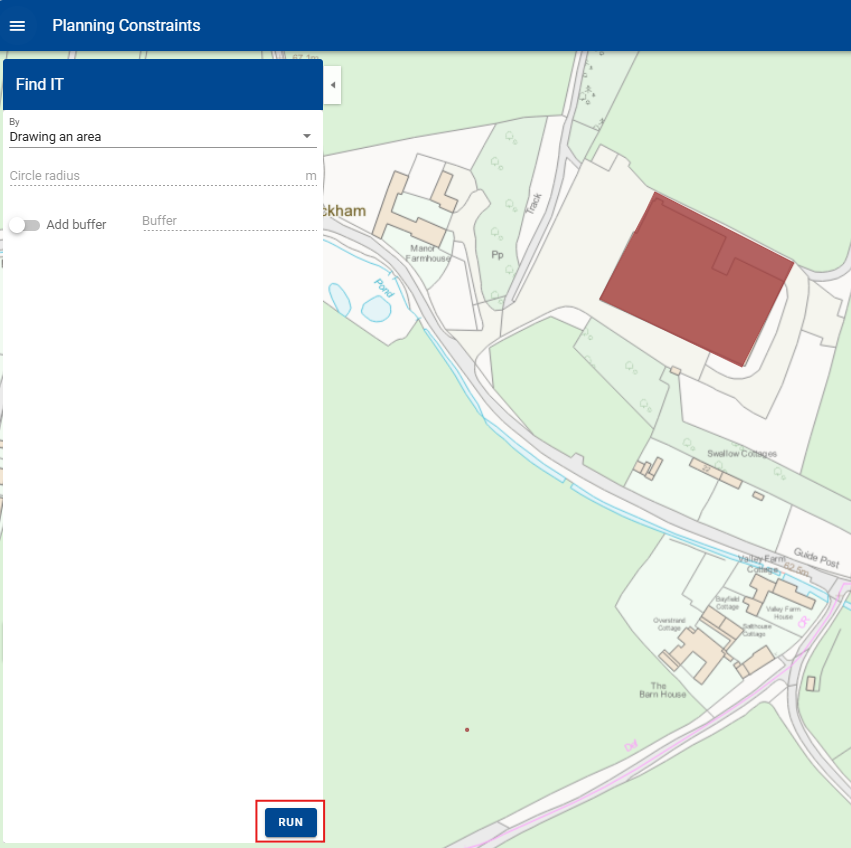
5. Select Run
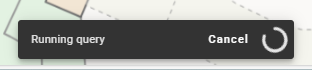
6. Wait for the tool to run. This can take a few minutes.
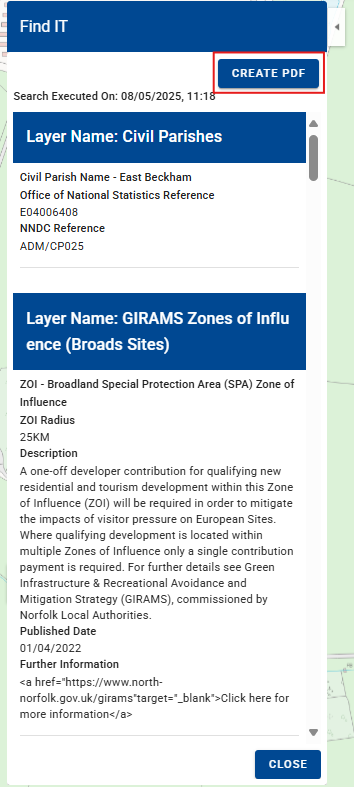
7. Once it's finished running, the constraints which intersect your plot will appear on the left pane. You can also create a PDF of the results.
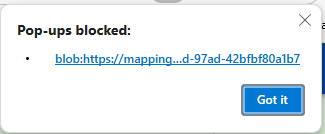
8. The PDF may take a few minutes to produce. The download pop-up may also be blocked by your browser. Select the blocked pop-up icon.

9. Select the URL to open the PDF.
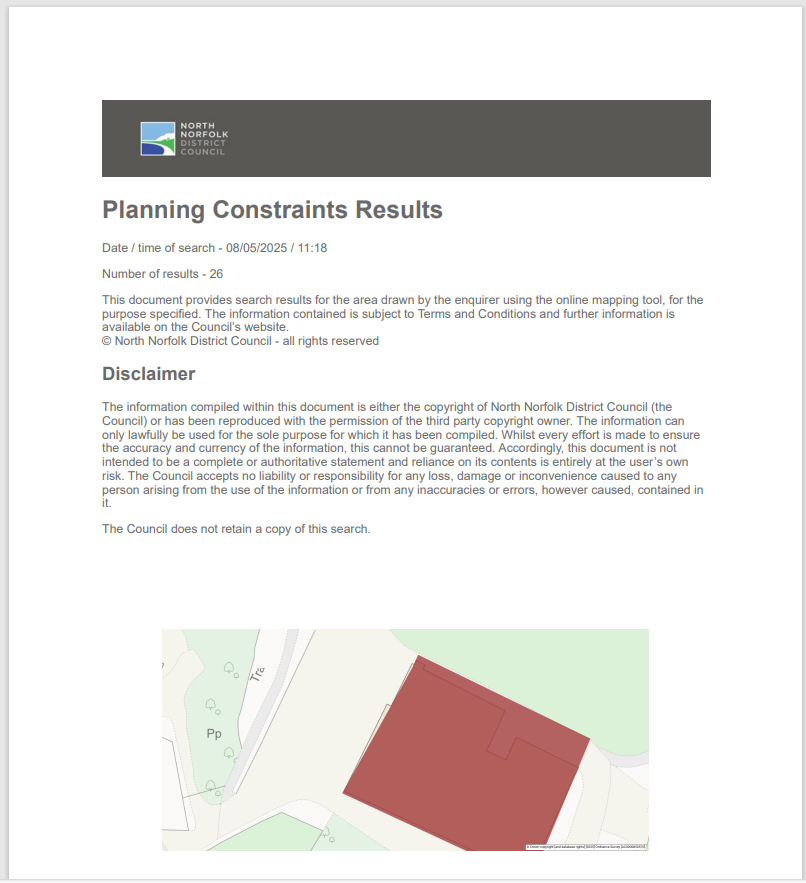
10. The PDF will then open.
Change the basemap layer
1. Expand the arrow on the right-hand side of the map.
![]()
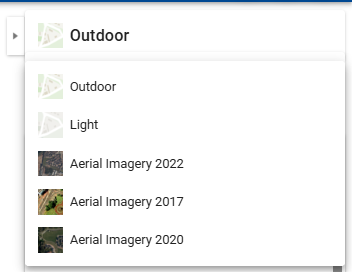
2. Select the current basemap layer.
3. This will display a list of the other basemaps. Select your preference.
Still need help?
Visit our contact us page for further assistance about our popular services and information.